Why Earned Value Management (EVM) Matters in Construction
Why “percent of budget spent” hides problems until it’s too late, and how three simple numbers — PV, EV and AC — give construction teams weeks of early warning. Worked examples, CPI/SPI, forecasting and three real case studies.
Project names, parties and commercially sensitive figures referenced in this article have been anonymised or generalised. Examples reflect real situations encountered across multiple projects; they are not attributed to any specific client, contractor or contract.
Every week, on every site, someone asks the same three questions. How far along are we? What has it cost so far? Are we going to finish on budget and on time?
Most projects answer the first two with a gut feel and the third with hope. Then everyone looks at two reports that don't talk to each other — a cost report written in dollars and a programme written in dates — and tries to guess.
Earned Value Management fixes that by converting progress into the same unit as cost: money. Once schedule and cost speak the same language, you can compare them directly, and the answers come out of simple subtraction.
This article is about why that matters — what EVM catches that a cost report structurally cannot, and how much earlier it catches it. If you already run EVM and want the setup mechanics, my earlier piece on Earned Value Management on Real Construction Projects covers the reporting cadence and the metrics that move the needle.
A note on the numbers: the figures below are illustrative and rounded for teaching, drawn from the worked examples in my EVM Field Guide for Construction. Apply your own project data and commercial judgement.
Why "Percent of Budget Spent" Lies to You
The most common progress measure on construction sites is also the most dangerous one: money spent as a percentage of budget. It feels like progress because the number goes up every month.
But spending money is not the same as building work. Consider one project, seen two ways:
| Measure | Reading |
|---|---|
| Budget spent | 80% |
| Time elapsed | 70% |
| Work actually built | 60% |
A cost report says this project is fine — 80% spent, most of the programme gone. EVM says the opposite: you have paid for 80% of the job and received 60% of it. Every dollar is buying you 75 cents of construction, and you're behind programme as well.
Same project, same data, completely different conversation. The difference is that EVM compares spend against work done, not against the calendar or the budget remaining.
And the timing matters more than the insight. Cost and schedule problems compound. A productivity issue caught in month 2 costs one toolbox talk and a revised crew plan. The same issue found in month 8 costs acceleration, overtime and a difficult client meeting. EVM won't fix your project — it tells you the truth about it while you still have options.
The Three Numbers Behind Everything
Every variance, index and forecast in EVM is built from three numbers. Understand these and you understand the method.
| What it is | On site it sounds like | |
|---|---|---|
| PV — Planned Value | What the plan says you should have completed by today, priced in dollars | "By end of week 12 we planned to finish $480k of work" |
| EV — Earned Value | What you have actually completed by today, priced at budget rates | "The work standing on site today is worth $410k at budget rates" |
| AC — Actual Cost | What you actually spent to do that work | "We have spent $455k getting to this point" |
The idea that trips most people up is Earned Value. EV is not what the work cost you — it's what the work is worth according to your budget. If your budget priced the ground-floor slab at $60,000 and the slab is finished, you have earned $60,000, even if it actually cost $71,000 to pour. The $71,000 goes into Actual Cost, and the gap between the two is your cost problem.
That distinction is the whole engine. Price progress at actual cost instead, and an expensive blowout starts looking like extra progress — the worse your productivity, the better your numbers. Budget rates keep the measuring stick fixed.
Don't let the terminology scare the site team, either. PMBOK calls these BCWS, BCWP and ACWP. Same numbers, older names. On site: PV is the plan, EV is the work, AC is the spend. Your foreman doesn't need acronyms to tell you the slab is finished.
Your First EVM Calculation
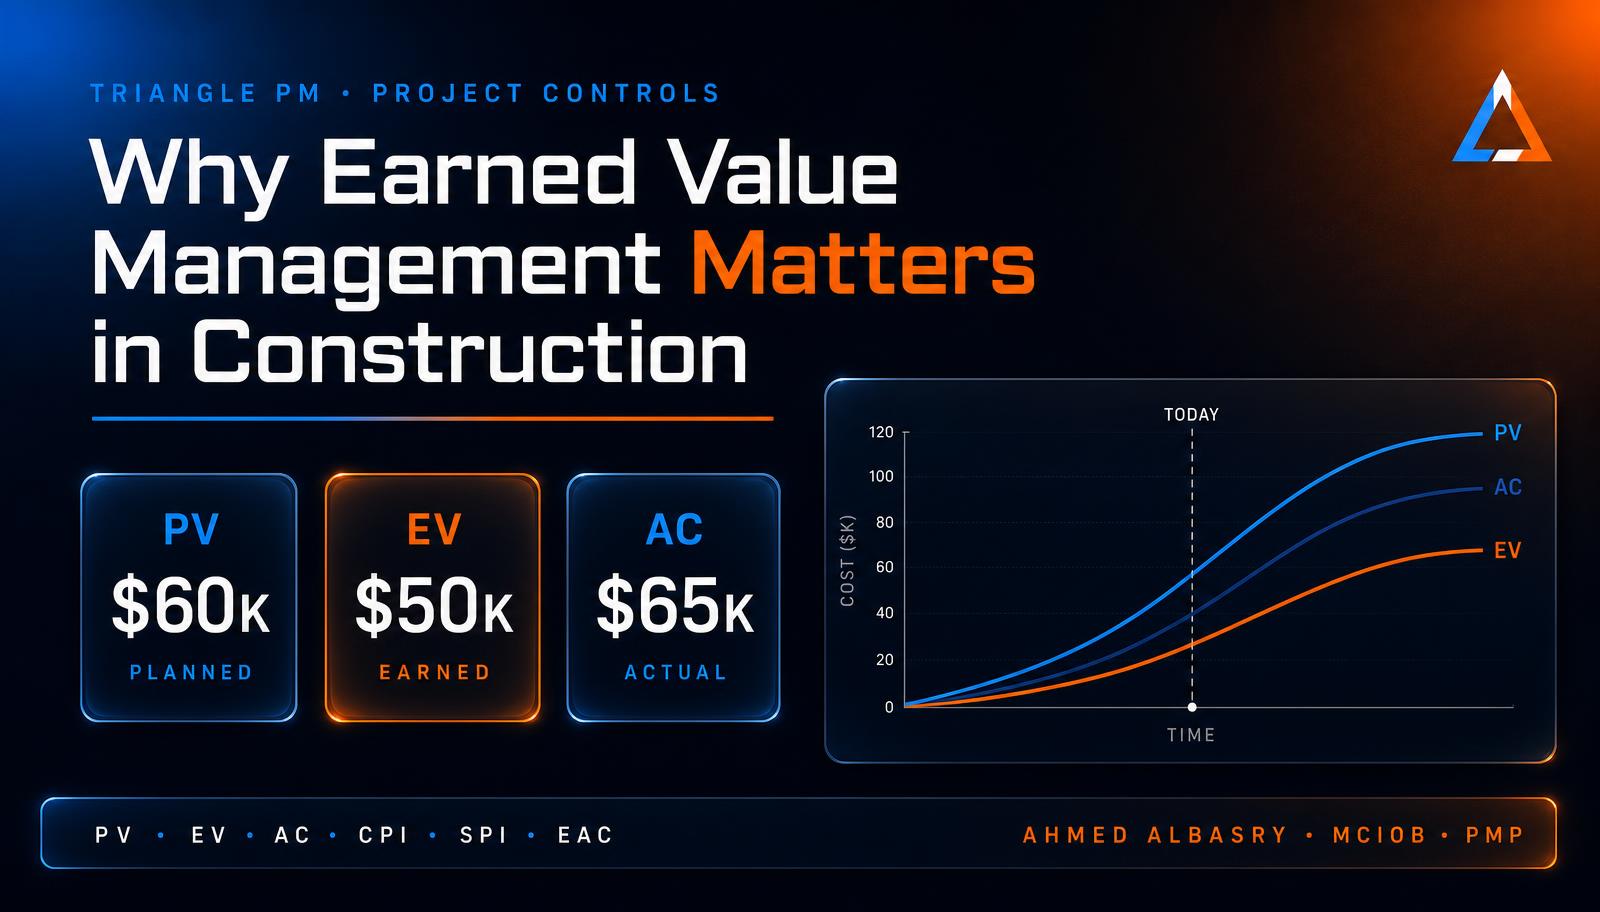
A residential project includes a ground-floor slab package budgeted at $100,000, programmed over 10 working days at a steady rate. We're at the end of day 6. The site diary says the slab is 50% complete. The cost system shows $65,000 spent.
| Step | Question | Calculation | Result |
|---|---|---|---|
| 1. PV | Where should we be by day 6? | $100,000 × (6 ÷ 10) | $60,000 |
| 2. EV | What is the work done worth? | $100,000 × 50% | $50,000 |
| 3. AC | What have we spent? | From invoices and timesheets | $65,000 |
Now the two comparisons that are the whole method:
- Schedule Variance (SV = EV − PV): $50,000 − $60,000 = −$10,000. We are $10k of work behind plan.
- Cost Variance (CV = EV − AC): $50,000 − $65,000 = −$15,000. The work has cost $15k more than it's worth.
Six days in, this package is behind schedule and over budget — and you can prove it with numbers rather than opinions. A traditional "spent vs budget" report would show $65k of a $100k budget and conclude everything is fine.
That's it. Everything else in EVM is this arithmetic, scaled up.
The one number that gets distorted
Actual Cost sounds like the easy one — just read the accounts. On a real project it's the most distorted, because invoices arrive late, subcontract claims lag the work, and materials get billed before they're fixed.
Compare fresh EV against stale AC and every project looks under budget — until the invoices land and the savings evaporate. The fix is accruals: estimate the value of work done but not yet billed, and include it every month, consistently.
On the worked example running through my field guide — a $500k residential block — the month-3 accrual line was $14k. Without it, AC read $261k and the project looked almost on budget. With it, AC was $275k against $259k earned. A $14k lie told by paperwork lag.
Reading the Two Gauges: CPI and SPI
Variances tell you the size of a problem in dollars. Indices tell you its rate — and rates are what you forecast with.
CPI = EV ÷ AC. SPI = EV ÷ PV. Above 1.0 is good, exactly 1.0 is on plan, below 1.0 is trouble. That's the whole rule.
For the residential block at month 3: CPI = 259 ÷ 275 = 0.94. SPI = 259 ÷ 280 = 0.93. The project is losing six cents on every dollar and producing at 93% of the planned pace. Neither is catastrophic. Both compound if ignored.
Read together, the two indices place any project in one of four boxes — and each box has a different correct response:
| Behind schedule (SPI < 1) | Ahead (SPI > 1) | |
|---|---|---|
| Under budget (CPI > 1) | Often late invoices, not savings. Verify AC before celebrating. | Protect it. Bank the gain, don't relax controls. |
| Over budget (CPI < 1) | Act now. Recovery plan, crew review, honest client conversation. | Buying speed. Check the acceleration is worth its cost. |
The top-left box catches more projects than any other. Low spend while behind schedule is usually late invoicing or slow production — not efficiency. Real savings and fake savings look identical for about six weeks.
This is also what makes indices useful upward. A contracts director asking for status on three jobs can get: "CPI 1.03, SPI 0.97 — making money, slightly behind, recovery in hand. CPI 0.94, SPI 0.93 — losing six cents in the dollar and pace; formwork fix underway. CPI 0.99, SPI 1.06 — ahead of plan at breakeven cost; checking the acceleration isn't burning margin." Three projects, thirty seconds, zero ambiguity.
Forecasting: The Question the Board Actually Asks
Everything above describes today. The only question the client really cares about is what this will cost at the end.
EAC = BAC ÷ CPI is the default forecast, and it assumes current cost performance continues. For the block: $500k ÷ 0.94 = $532k against a $500k budget.
Run the alternatives and you get a range rather than false precision:
| Method | Assumption about remaining work | EAC |
|---|---|---|
| BAC ÷ CPI | Cost performance continues as-is | $532k |
| AC + (BAC − EV) | Overrun was one-off; rest goes to budget | $516k |
| AC + (BAC − EV) ÷ (CPI × SPI) | Cost and schedule pressure both continue | $552k |
Report it as $516k–$552k, most likely $532k. Use the middle method only when you can name the one-off cause and show it's closed.
Then run the reality check. TCPI = (BAC − EV) ÷ (BAC − AC) tells you the efficiency required on all remaining work to still land on the original budget. For the block: (500 − 259) ÷ (500 − 275) = 1.07. Having produced at 0.94 for three months, the team would need 1.07 for the rest of the job — a 14% efficiency swing — just to break even.
As a rule of thumb, a TCPI more than about 0.05 above your current CPI means the original budget is gone. Possible with real changes; impossible by hoping. The professional move is to say so early and manage the new number.
Teams sit on bad forecasts because an EAC feels like admitting failure. It's the opposite. An early, evidenced EAC gives the client time to arrange funding, re-scope or re-sequence — all cheaper than a late surprise. The forecast that damages careers is the one revealed in the last month.
Three Projects, Three Different Lessons
1. Residential — steady indices, widening gap
24 townhouses, twelve months, BAC $8.4M. Across six months the indices barely moved: SPI hovered at 0.89–0.91, CPI at 0.90–0.94. Nothing looked dramatic in any single month.
But the cumulative gap grew from $30k to $470k.
That signature — steady bad indices with a widening dollar gap — is a systemic problem, not bad luck. The drill-down put 80% of the damage in two named causes: framing crews earning $86/hr against $103 planned, and eleven units carrying an unformalised services redesign at roughly $9k over each.
Months 1–3 had been dismissed as start-up noise. That's the most common way early warnings die. A 0.90 SPI in month 1 is a small number of dollars and a very large piece of information.
The recovery — pre-nailed frames, a formal variation for the redesigned units, a third framing crew for eight weeks — landed the project at $9.05M against a variation-adjusted $8.49M. A 6.6% overrun: painful, but disclosed from month 6 with a monthly EAC. As the developer put it at handover, the forecast was wrong once, early, then boringly right for six months.
2. Commercial — healthy cost, sick schedule
Nine-storey office, eighteen months, BAC $22M. At month 9: CPI 0.98, SPI 0.90. Cost essentially on track; roughly 5.5 weeks of work behind.
The first instinct in the project review was to throw more resource at structure. CPI 0.98 said productivity wasn't the problem — the post-tensioned floor cycle was running 8.5 days per level against a planned 7. More people on an unchanged cycle burns money for very little time.
So the team priced the options per week recovered instead:
| Option | Cost | Time recovered | $/week |
|---|---|---|---|
| Second formwork set + crane hours | $380k | ≈ 3 weeks | $127k |
| Early facade procurement, start L1–4 | $140k | ≈ 2.5 weeks | $56k |
| Overlap fit-out behind facade | $95k | ≈ 2 weeks | $48k |
| Do nothing (LDs + prelims, ~2 months) | ≈ $600k | — | — |
They ran options 2 and 3: $235k to recover about 4.5 weeks, with option 1 held in reserve behind an explicit trigger. Recovery was tracked with a weekly SPI computed only on the recovery chain, so improvement wasn't diluted by the rest of the job. It moved 0.90 → 0.94 → 0.97 over eight weeks.
Final: 19.5 months, CPI 0.99 at completion. The building was late — but the lateness was chosen, priced and managed, which is a different thing from being late by surprise.
3. Civil — splitting the variance into excusable and ours
6.5 km road upgrade, BAC $15M, earthworks-driven. EV came straight from surveyed volumes: measured m³ × $12. No stage weights, no opinions — the dirt is counted.
At month 5 the earthworks package showed SV −$504k, SPI 0.80. The site had lost 14 days to recorded wet weather against 6 allowed in the baseline. At ~2,800 m³/day, those 8 excess days explained about 22,400 m³ ≈ $270k of the variance. The remaining $234k was productivity: haul cycles running 20% long because a culvert rebuild had left one section single-lane.
The EOT submission didn't argue feelings. It showed baseline PV, measured volumes, daily records, and the arithmetic separating weather from performance. Conceding its own $234k openly is what made the $270k claim credible. The 8-day EOT was granted without dispute.
The Mistakes That Kill EVM Systems
Nearly every failed implementation fails in one of a familiar handful of ways:
| Mistake | What it looks like | The fix |
|---|---|---|
| Moving the baseline | Variances always ≈ zero; nobody remembers approving a change | Freeze PV; changes only via approved variations |
| Optimistic % complete | Packages at 90% for weeks, then an EV cliff | Count-based methods; cap judgement at 80–90% |
| AC missing accruals | CPI looks great until invoices land | Book work done, not invoices paid |
| Variation cost in baseline packages | CPI sinking while crews work hard on VO scope | Separate cost codes for pending variations |
| Averaging package indices | A project CPI that matches no arithmetic | Indices from totals: ΣEV ÷ ΣAC |
| Weekly cost reporting | Wobbling CPIs nobody trusts by month three | Weekly = physical progress; monthly = cost |
| Numbers without narrative | Reports get read; nothing changes | Every variance gets what moved, why, and the action |
| Hiding a worsening EAC | One catastrophic reveal in the final quarter | EAC monthly, as a range, in the open |
Three habits prevent most of them. Freeze and reconcile — baseline frozen, register summing to BAC every month. Measure, don't estimate — units and rules of credit wherever possible, cost accrued when work happens. Report to decide — every report ends in actions with owners and dates.
Which points at the mistake underneath all the others: treating EVM as a reporting obligation instead of a control system. If your EVM data has never changed a decision, the system is already dead — the reports just haven't noticed yet.
Conclusion: The Cheapest Early-Warning System You Can Build
EVM is not a software problem or a certification topic. It's three numbers you already have — the plan, the work, the spend — compared in a way that makes it impossible to confuse spending money with building work.
You don't need planning software to start. The residential block worked through this article is five packages across five months. Budgets from the approved cost plan, dates from the accepted programme, splits agreed with the site manager over the drawings. One afternoon in Excel.
It won't be perfect. It doesn't need to be. A one-tab tracker that exists beats a perfect system that never gets built, because the value isn't precision — it's the gap between the lines showing up in month 3 instead of month 11.
Pick one live package this week. Price the plan, price the work, total the spend. If EV sits below both PV and AC, you've just found something a cost report wouldn't have told you for another two months.
Take It Further with Triangle PM
If you want to put this into practice on your next project, Triangle PM has the tools ready to go:
- EVM Field Guide for Construction — the full practitioner's guide behind this article: one continuous worked example from baseline to forecast, progress measurement rules, the Excel build, three complete case studies, and ten ready-to-use templates.
- EVM & Cost Control Calculators — CPI, SPI, EAC, ETC, TCPI, CV and SV, calculated in the browser.
- Project Controls Templates — EVM tracker, cost control log, schedule baseline workbook and integrated reporting cadence.
- Full Library Bundle — all 31 production templates across 16 disciplines, FIDIC and NZS 3910 aligned.
- How a PMO Earns Its Keep on a Construction Project — the portfolio-level view that sits above project controls.
Templates, calculators and books built for site delivery
Explore the Triangle PM resource libraryAhmed Albasry is a Senior Building Surveyor and Construction Project Manager with 20+ years across residential, commercial and infrastructure projects, and the creator of the Construction Management Excellence Framework. PMBOK® and PMP® are registered marks of the Project Management Institute, Inc. Cost and schedule figures are illustrative and rounded for teaching — always apply your own project data and professional judgement.
Construction project manager (PMP, MCIOB) with 20+ years on infrastructure, commercial and industrial builds across the GCC and NZ. Writes about the controls, contracts and field practices that actually move projects.
Read full bio →